Market Outlook
November 03, 2016
Market Cues
Domestic Indices
Chg (%)
(Pts)
(Close)
Indian markets are likely to open negative tracking global cues and SGX Nifty.
BSE Sensex
(1.3)
(349)
27,527
Nifty
(1.3)
(112)
8,514
U.S. stocks extended losses on Wednesday, with the S&P 500 recording its longest
Mid Cap
(1.8)
(247)
13,194
losing streak in five years after the Federal Reserve, as expected, kept interest rates
Small Cap
(1.8)
(250)
13,307
unchanged. In announcing its decision, the Fed indicated that it doesn’t need for
much more evidence to justify a move, boosting the chances of a hike at its final
Bankex
(1.2)
(256)
21,993
meeting of the year. The S&P 500 index dropped 14 points to close at 2,098, falling
for seven sessions in a row for the first time since November 2011. The Dow Jones
Global Indices
Chg (%)
(Pts)
(Close)
Industrial Average declined 77 points to finish at 17,960.
Dow Jones
(0.4)
(77)
17,960
European stocks ended sharply lower on Wednesday, as the possibility of a victory
Nasdaq
(0.9)
(48)
5,106
by Donald Trump in next week’s U.S. presidential election and lower oil prices
FTSE
(1.0)
(72)
6,845
spooked global equity markets. The U.K.’s FTSE 100 index declined 1% to 6,845.
Nikkei
(1.8)
(308)
17,135
On the domestic turf, benchmark share indices ended over
1% lower on
Hang Seng
(1.5)
(337)
22,811
Wednesday, tracking a sell-off in global markets, amid growing uncertainty over the
Shanghai Com
(0.6)
(20)
3,103
US elections and the Fed's stance on interest rates at its two-day meet which
concludes later today. The S&P BSE Sensex ended down 349 points at 27,527 and
Advances / Declines
BSE
NSE
the Nifty50 closed 112 points lower at 8,514.
Advances
966
316
Result Review
Declines
1,990
1,336
Aurobindo Pharma may buy Portugal's Generis, deal likely to be valued at
Unchanged
105
50
$200 million
Detailed analysis on Pg2
Volumes (` Cr)
BSE
3,274
Investor’s Ready Reckoner
NSE
18,578
Key Domestic & Global Indicators
Stock Watch: Latest investment recommendations on 150+ stocks
Net Inflows (` Cr)
Net
Mtd
Ytd
Refer Pg6 onwards
FII
(96)
(96)
44,918
Top Picks
MFs
560
8,106
22,052
CMP
Target
Upside
Company
Sector
Rating
(`)
(`)
(%)
Amara Raja Batteries Auto & Auto Ancill.
Buy
1,029
1,218
18.4
Top Gainers
Price (`)
Chg (%)
HCL Tech
IT
Buy
764
1,000
30.9
Sreinfra
84
7.0
Bharat Electronics
Capital Goods
Accumulate
1,302
1,414
8.6
Skfindia
1,491
5.6
Equitas Holdings
Financials
Buy
176
235
33.7
Mmtc
52
4.7
Navkar Corporation Others
Buy
203
265
30.6
More Top Picks on Pg4
M&M
1,369
3.5
Infratel
367
3.2
Key Upcoming Events
Previous
Consensus
Date
Region
Event Description
Reading
Expectations
Top Losers
Price (`)
Chg (%)
Nov 03 US
FOMC rate decision
0.50
0.50
Canbk
294
(5.6)
Nov 03 UK
BOE Announces rates
0.25
0.25
Orientbank
121
(5.4)
Nov 04 US
Unnemployment rate
5.00
4.90
Gsfc
98
(5.4)
Nov 04 Germany
PMI Services
54.10
54.10
Nov 04 US
Change in Nonfarm payrolls
156.00
175.00
Hdil
77
(4.9)
6.(
More Events on Pg5
Deltacorp
169
(4.9)
As on November 02, 2016
Market Outlook
November 03, 2016
News analysis
Aurobindo Pharma may buy Portugal's Generis, deal likely to be
valued at $200 million
Hyderabad-based Aurobindo Pharma has expressed preliminary interest in
acquiring Portuguese drug maker Generis Farmaceutica for about $200 million.
Generis has presence across anti-infective, respiratory, anti-diabetes and
dermatology drugs, besides a contract manufacturing and analytical services arm.
It generated sales of around $60 million last year.
Aurobindo's bid comes on the heels of last month’s shot at Israeli drug maker
Teva's UK product portfolio, where it was outbid by Intas Pharmaceuticals.
Aurobindo's move to buy the Portuguese firm is seen as resurrection of an earlier
interest after its Teva chase was foiled. The Generis deal has been on the table for
a few months now and it fits Aurobindo's valuation range and its ambitions in
Europe.
Aurobindo has been among Indian drug makers keen on acquisition-led growth of
international operations. Its global sales reached
`13,896cr in FY16, from
`5,855cr in FY13. In Europe, Aurobindo's sales shot to `3,130cr last year, an 88%
CAGR from `468cr in 2013. The company wants to consolidate presence among
the top 10 in Europe, where its target markets are France, Germany, the
Netherlands, Spain, the UK, Portugal, Italy and Romania.
At a recent investor presentation, the company said lower generics penetration in
Italy, Spain and France offers growth potential as the share of generics improves. It
is also targeting extended presence in certain East European markets.
Although generics is beginning to show green shoots in European markets, a
section of the Indian industry believes it will be a difficult market due to its
scattered healthcare systems, a slow economic growth rate, near stagnating
healthcare spend and limited scope to increase prices due to tender-based
procurements in key markets. Besides, securing manufacturing efficiencies is a
challenge.
Aurobindo has worked around those issues and fared better than most of its
Indian peers. Two years ago, Aurobindo acquired the European business of the
erstwhile Actavis, which incurred losses in the early phase. It has started showing
signs of a turnaround in the last few quarters.
In recent times, Indian drug makers have turned aggressive bidders for
international assets. Last month, it was reported that Sun and Lupin were among a
handful of parties interested in buying the dermatology assets of German giant
Bayer for a deal that may be priced at over $1billion.
Market Outlook
November 03, 2016
Quarterly Bloomberg Brokers Consensus Estimate
Ambuja Cement Ltd - Nov 3, 2016
Particulars ( ` cr)
3QCY16E
3QCY15
y-o-y (%)
2QCY16
q-o-q (%)
Net sales
2,624
2,095
25.3
2,541
3.3
EBITDA
501
310
61.7
601
(16.6)
EBITDA margin (%)
19.1
14.8
23.6
Net profit
333
154
116.6
400
(16.7)
Union Bank Of India Ltd - Nov 4, 2016
Particulars ( ` cr)
2QFY17E
2QFY16
y-o-y (%)
1QFY17
q-o-q (%)
Net profit
203
658
(69.2)
166
22.1
Titan Ltd - Nov 4, 2016
Particulars ( ` cr)
2QFY17E
2QFY16
y-o-y (%)
1QFY17
q-o-q (%)
Net sales
3,058
2,655
15.2
2,783
9.9
EBITDA
275
203
35.5
292
(5.9)
EBITDA margin (%)
9.0
7.6
10.5
Net profit
180
145
23.8
127
42.1
United Breweries Ltd - Nov 4, 2016
Particulars ( ` cr)
2QFY17E
2QFY16
y-o-y (%)
1QFY17
q-o-q (%)
Net sales
1,640
1,016
61.3
1,486
10.4
EBITDA
296
150
97.1
290
2.1
EBITDA margin (%)
18.0
14.8
19.5
Net profit
142
48
194.2
147
(3.6)
Punjab National Bank Ltd - Nov 5, 2016
Particulars ( ` cr)
2QFY17E
2QFY16
y-o-y (%)
1QFY17
q-o-q (%)
Net profit
125
621
(80.0)
306
(59.4)
Economic and Political News
S&P affirms India's sovereign ratings, says outlook is stable
US Fed holds interest rates, sets up possible December rate hike
Hillary Clinton narrowly beats Donald Trump among independents in new poll
Corporate News
Hero MotoCorp sales up 4% at 6,63,153 units in October
Adani, JSW and SembCorp in race to buy BC Jindal group's Odisha power
plant
Zensar Technologies acquires UX design agency Foolproof
Market Outlook
November 03, 2016
Top Picks ★★★★★
Large Cap
Market Cap
CMP
Target
Upside
Company
Rationale
(` Cr)
(`)
(`)
(%)
To outpace battery industry growth due to better technological
Amara Raja Batteries
17,571
1,029
1,218
18.4
products leading to market share gains in both the
automotive OEM and replacement segments.
Healthy pace of branch expansion, backed by distribution
Axis Bank
1,13,538
476
630
32.4
network, will be the driving force for the bank’s retail business
and overall earnings.
Uptick in defense capex by government when coupled with
Bharat Electronics
31,244
1,302
1,414
8.6
BELs strong market positioning, indicate that good times are
ahead for BEL.
The stock is trading at attractive valuations and is factoring all
HCL Tech
1,07,803
764
1,000
30.9
the bad news.
Back on the growth trend, expect a long term growth of 14%
Infosys
2,25,353
981
1,249
27.3
to be a US$20bn in FY2020.
Source: Company, Angel Research
Mid Cap
Market Cap
CMP
Target
Upside
Company
Rationale
(` Cr)
(`)
(`)
(%)
We expect the company would report strong profitability
Asian Granito
799
266
351
32.2
owing to better product mix, higher B2C sales and
amalgamation synergy.
Among the top 4 players in the consumer durables segment.
Bajaj Electricals
2,632
261
306
17.5
Improved profitability backed by turn around in E&P segment.
Strong order book lends earnings visibility.
Favourable outlook for the AC industry to augur well for
Cooling products business which is out pacing the market
Blue Star
5,307
557
634
13.9
growth. EMPPAC division's profitability to improve once
operating environment turns around.
With a focus on the low and medium income (LMI) consumer
Dewan Housing Finance
9,926
317
350
10.4
segment, the company has increased its presence in tier-II &
III cities where the growth opportunity is immense.
Strong loan growth backed by diversified loan portfolio and
Equitas Holdings
5,894
176
235
33.7
adequate CAR. ROE & ROA likely to remain decent as risk of
dilution remains low. Attractive valuations considering growth.
Economic recovery to have favourable impact on advertising
& circulation revenue growth. Further, the acquisition of a
Jagran Prakashan
6,378
195
225
15.3
radio business (Radio City) would also boost the company's
revenue growth.
Speedier execution and speedier sales, strong revenue visibilty
Mahindra Lifespace
1,728
421
522
23.9
in short-to-long run, attractive valuations
We expect the company to report strong growth on back of
healthy growth in domestic branded sales (owing to
Mirza International
1,095
91
113
24.2
aggressive ad spend and addition in the number of EBOs &
multi-brand outlets [MBOs]) and healthy export revenues.
Massive capacity expansion along with rail advantage at ICD
Navkar Corporation
2,893
203
265
30.6
as well CFS augurs well for the company.
Strong brands and distribution network would boost growth
Siyaram Silk Mills
1,457
1,554
1,714
10.3
going ahead. Stock currently trades at an inexpensive
valuation.
Market leadership in Hindi news genre and no. 2 viewership
ranking in English news genre, exit from the radio business,
TV Today Network
2,079
349
363
4.2
and anticipated growth in ad spends by corporates to benefit
the stock.
Source: Company, Angel Research
Market Outlook
November 3, 2016
Key Upcoming Events
Result Calendar
Date
Company
November 03, 2016 Ambuja Cements, Mphasis, MM Forging
Union Bank, Allahabad Bank, Central Bank, Competent Automobiles, Transport Corporation of India,
November 04, 2016
Radico Khaitan
Amara Raja Batteries, Automotive Axle, Mangalam Cement, Punjab Natl.Bank, Dena Bank, Bank of
November 05, 2016
Maharashtra, Relaxo, Sterling Tools
November 07, 2016 CEAT, ICICI Bank, Godrej Consumer, GlaxoSmith Con, Britannia, Cravatex, Aventis
November 08, 2016 Bharat Forge, Ashok Leyland, BHEL, Vesuvius India, UFO Moviez
Source: Bloomberg, Angel Research
Global economic events release calendar
Bloomberg Data
Date
Time
Country
Event Description
Unit
Period
Last Reported
Estimated
Nov 03, 2016
11:30 PM
US
FOMC rate decision
% Nov 2
0.50
0.50
5:30 PM
UK
BOE Announces rates
% Ratio Nov 3
0.25
0.25
Nov 04, 2016
6:00 PM
US
Unnemployment rate
% Oct
5.00
4.90
2:25 PM Germany
PMI Services
Value Oct F
54.10
54.10
6:00 PM
US
Change in Nonfarm payrolls
Thousands Oct
156.00
175.00
Nov 08, 2016
China
Exports YoY%
% Change Oct
(10.00)
(6.00)
3:00 PM
UK
Industrial Production (YoY)
% Change Sep
0.70
Nov 09, 2016
7:00 AM
China
Consumer Price Index (YoY)
% Change Oct
1.90
2.10
Nov 10, 2016
India
Imports YoY%
% Change Oct
(2.50)
India
Exports YoY%
% Change Oct
4.60
Nov 11, 2016
5:30 PM
India
Industrial Production YoY
% Change Sep
(0.70)
Nov 14, 2016
7:30 AM
China
Industrial Production (YoY)
% Change Oct
6.10
6.20
12:00 PM
India
Monthly Wholesale Prices YoY%
% Change Oct
3.57
Nov 15, 2016
3:30 PM Euro Zone
Euro-Zone GDP s.a. (QoQ)
% Change 3Q P
0.30
12:30 PM Germany
GDP nsa (YoY)
% Change 3Q P
3.10
3:00 PM
UK
CPI (YoY)
% Change Oct
1.00
Nov 16, 2016
3:00 PM
UK
Jobless claims change
% Change Oct
0.70
7:45 PM
US
Industrial Production
% Oct
0.06
0.10
US
Producer Price Index (mom)
% Change Oct
0.80
Source: Bloomberg, Angel Research
Market Outlook
November 03, 2016
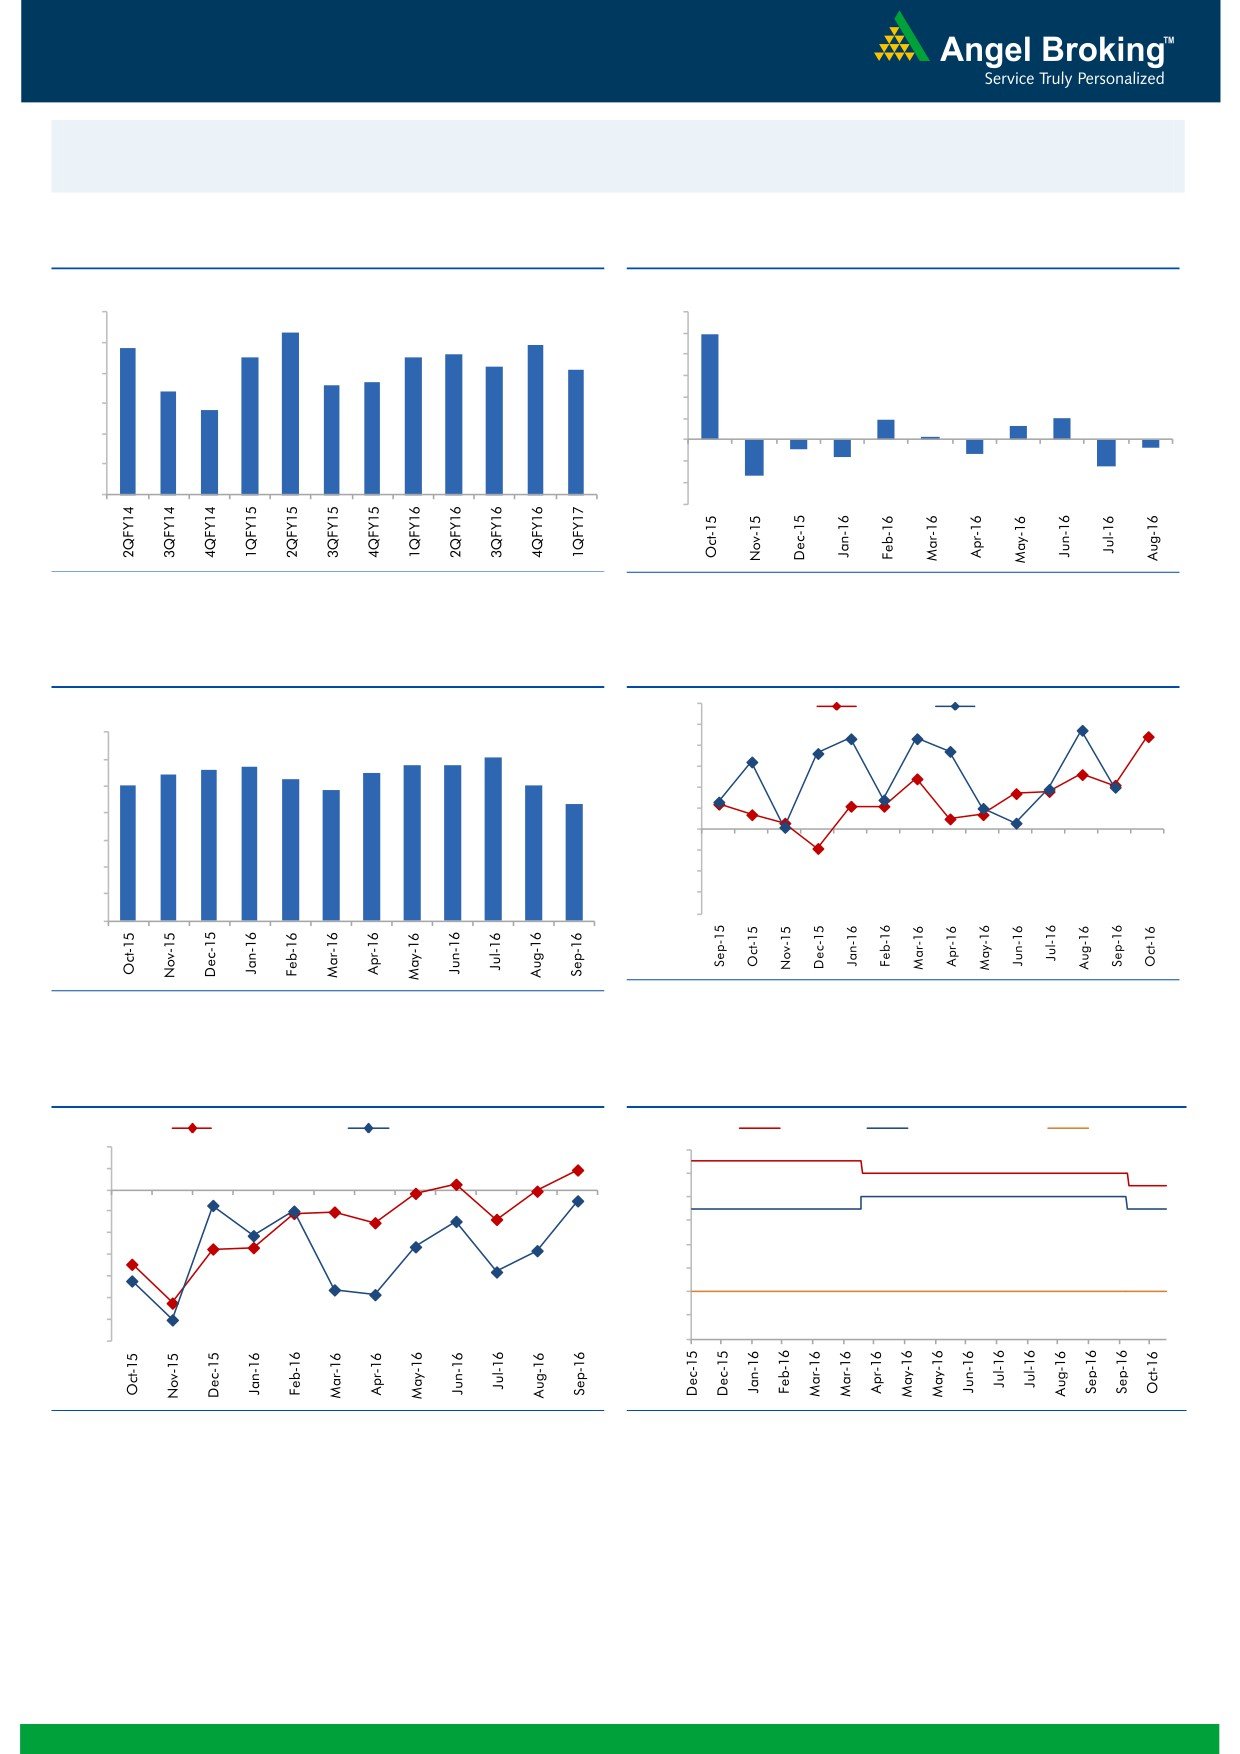
Macro watch
Exhibit 1: Quarterly GDP trends
Exhibit 2: IIP trends
(%)
(%)
9.0
12.0
8.3
9.9
7.8
7.9
10.0
8.0
7.5
7.5
7.6
7.2
7.1
8.0
6.6
6.7
7.0
6.4
6.0
5.8
6.0
4.0
1.9
2.0
1.3
2.0
0.3
5.0
-
4.0
(2.0)
(0.7)
(0.9)
(1.3)
(1.6)
(4.0)
(2.5)
3.0
(3.4)
(6.0)
Source: CSO, Angel Research
Source: MOSPI, Angel Research
Exhibit 3: Monthly CPI inflation trends
Exhibit 4: Manufacturing and services PMI
56.0
Mfg. PMI
Services PMI
(%)
55.0
7.0
6.1
54.0
5.6
5.7
5.8
5.8
6.0
5.4
5.5
5.0
5.3
5.1
53.0
4.8
5.0
4.3
52.0
4.0
51.0
50.0
3.0
49.0
2.0
48.0
1.0
47.0
46.0
-
Source: Market, Angel Research; Note: Level above 50 indicates expansion
Source: MOSPI, Angel Research
Exhibit 5: Exports and imports growth trends
Exhibit 6: Key policy rates
(%)
Exports yoy growth
Imports yoy growth
(%)
Repo rate
Reverse Repo rate
CRR
10.0
7.00
5.0
6.50
0.0
6.00
(5.0)
5.50
(10.0)
5.00
(15.0)
4.50
(20.0)
4.00
(25.0)
(30.0)
3.50
(35.0)
3.00
Source: Bloomberg, Angel Research
Source: RBI, Angel Research
Market Outlook
November 03, 2016
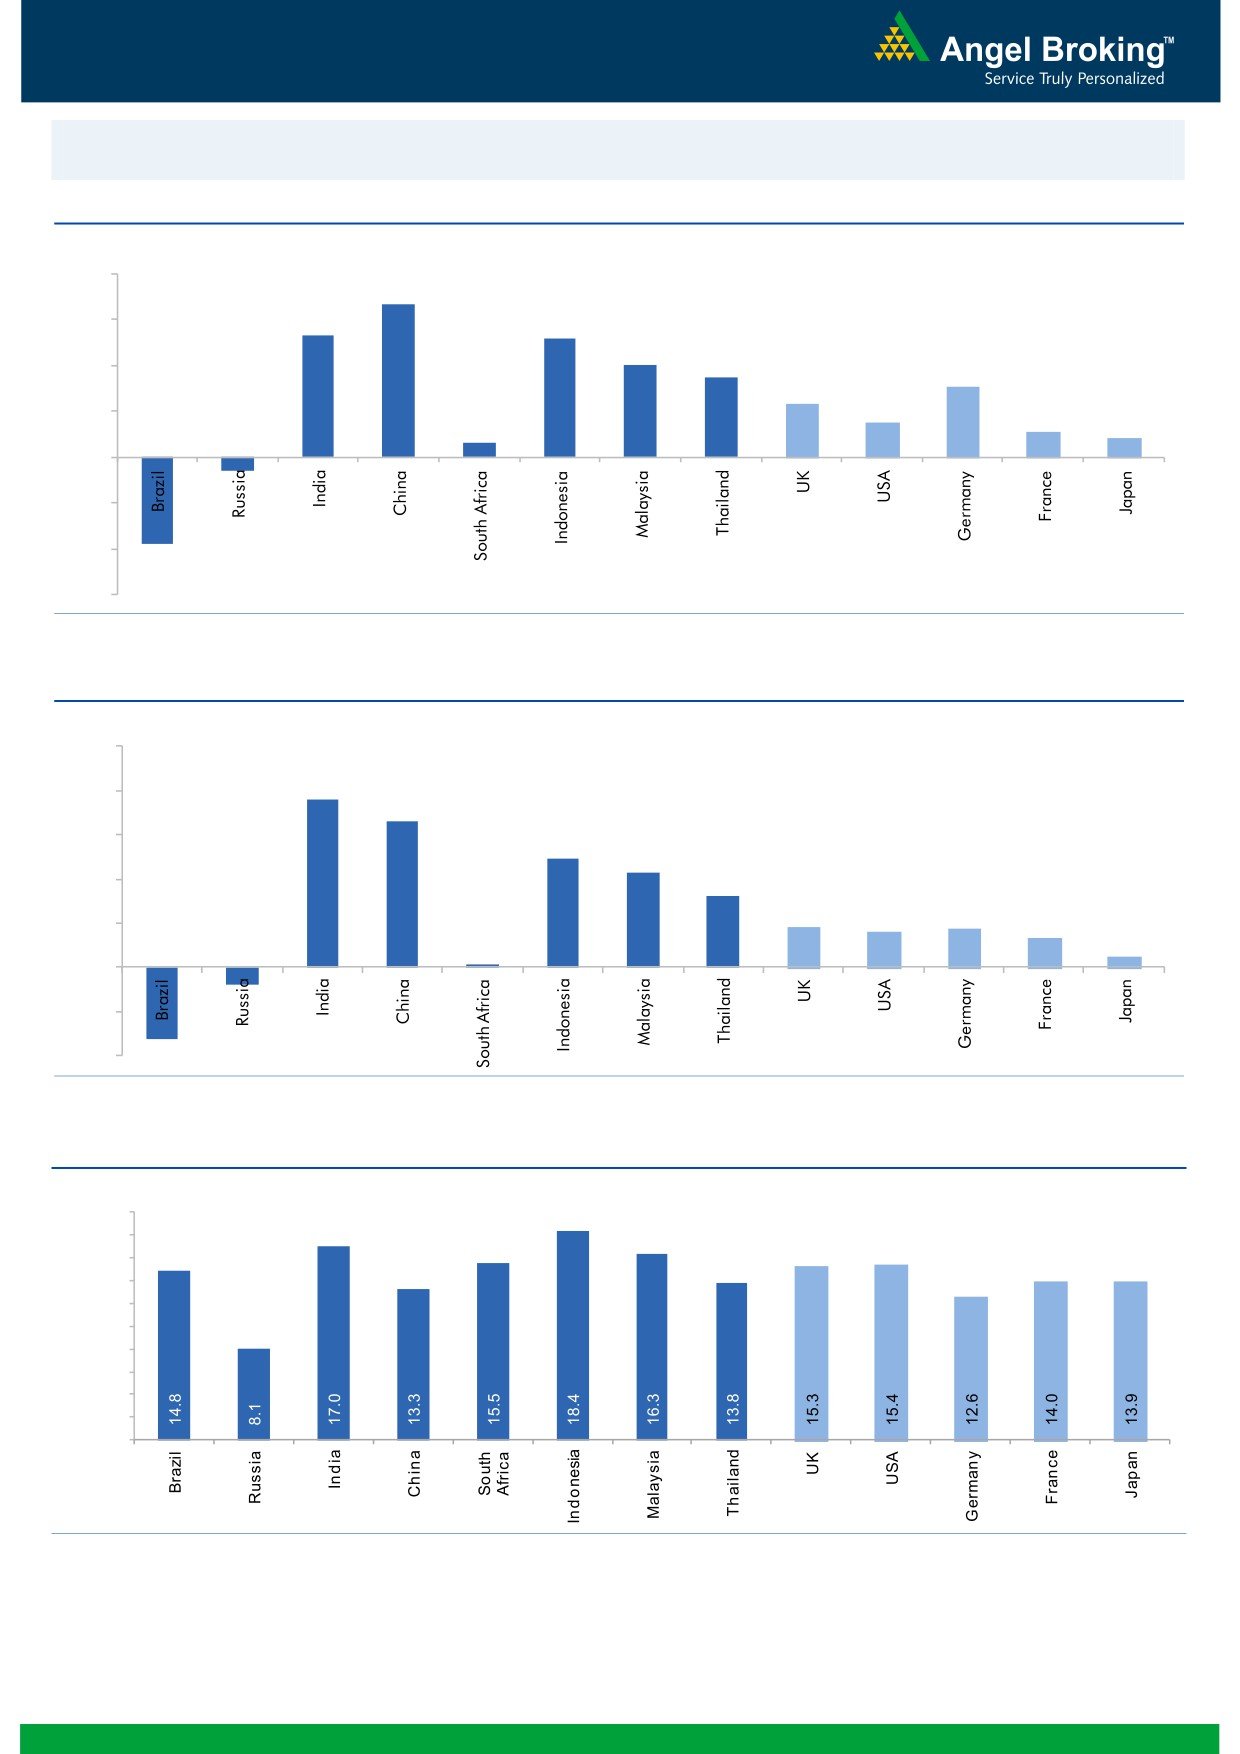
Global watch
Exhibit 1: Latest quarterly GDP Growth (%, yoy) across select developing and developed countries
(%)
8.0
6.7
6.0
5.3
0.6
5.2
4.0
3.5
4.0
3.1
2.3
1.5
2.0
1.1
0.8
-
(2.0)
(0.6)
(4.0)
(3.8)
(6.0)
Source: Bloomberg, Angel Research
Exhibit 2: 2016 GDP Growth projection by IMF (%, yoy) across select developing and developed countries
(%)
10.0
7.6
8.0
6.6
6.0
4.9
4.3
4.0
3.2
1.8
1.7
1.6
2.0
1.3
(0.8)
0.5
(3.3)
0.1
-
(2.0)
(4.0)
Source: IMF, Angel Research
Exhibit 3: One year forward P-E ratio across select developing and developed countries
(x)
20.0
18.0
16.0
14.0
12.0
10.0
8.0
6.0
4.0
2.0
-
Source: IMF, Angel Research
Market Outlook
November 03, 2016
Exhibit 4: Relative performance of indices across globe
Returns (%)
Country
Name of index
Closing price
1M
3M
1YR
Brazil
Bovespa
63,326
8.5
11.6
34.6
Russia
Micex
1,969
(0.1)
2.1
14.4
India
Nifty
8,514
(0.9)
(1.8)
3.1
China
Shanghai Composite
3,103
4.1
1.7
(9.1)
South Africa
Top 40
43,835
(2.9)
(3.9)
(9.4)
Mexico
Mexbol
47,303
0.1
1.6
4.3
Indonesia
LQ45
925
(2.0)
(0.2)
14.9
Malaysia
KLCI
1,660
0.4
0.4
(2.8)
Thailand
SET 50
938
(0.7)
(0.8)
2.6
USA
Dow Jones
17,960
(1.5)
(1.5)
0.7
UK
FTSE
6,845
(2.0)
3.2
7.5
Japan
Nikkei
17,135
4.2
3.4
(9.0)
Germany
DAX
10,371
(0.6)
2.7
(4.0)
France
CAC
4,415
(0.3)
2.1
(10.4)
Source: Bloomberg, Angel Research
Stock Watch
November 03, 2016
Company Name
Reco
CMP
Target
Mkt Cap
Sales ( Čcr )
OPM(%)
EPS (Č)
PER(x)
P/BV(x)
RoE(%)
EV/Sales(x)
(Č)
Price ( Č)
( Č cr )
FY17E FY18E
FY17E
FY18E
FY17E
FY18E
FY17E
FY18E
FY17E
FY18E
FY17E
FY18E
FY17E
FY18E
Agri / Agri Chemical
Rallis
Neutral
216
-
4,208
1,937
2,164
13.3
14.3
9.0
11.0
24.0
19.7
4.2
3.7
18.4
19.8
2.4
2.1
United Phosphorus
Neutral
680
-
34,470
15,176
17,604
18.5
18.5
37.4
44.6
18.2
15.3
3.6
3.0
21.4
21.2
2.5
2.1
Auto & Auto Ancillary
Ashok Leyland
Buy
90
111
25,556
22,407
26,022
10.6
10.6
5.2
6.4
17.2
14.0
3.9
3.3
23.6
24.7
1.2
1.0
Bajaj Auto
Neutral
2,818
-
81,533
25,093
27,891
19.5
19.2
143.9
162.5
19.6
17.3
5.5
4.7
30.3
29.4
3.0
2.6
Bharat Forge
Neutral
852
-
19,838
7,726
8,713
20.5
21.2
35.3
42.7
24.1
20.0
4.5
4.0
18.9
20.1
2.7
2.3
Eicher Motors
Neutral
24,780
-
67,305
16,583
20,447
17.5
18.0
598.0
745.2
41.4
33.3
14.2
10.8
41.2
38.3
3.9
3.1
Gabriel India
Neutral
121
-
1,739
1,544
1,715
9.0
9.3
5.4
6.3
22.4
19.2
4.2
3.8
18.9
19.5
1.1
1.0
Hero Motocorp
Neutral
3,324
-
66,381
31,253
35,198
15.3
15.0
172.3
192.1
19.3
17.3
7.1
6.1
38.9
37.0
2.0
1.8
Jamna Auto Industries Neutral
225
-
1,794
1,486
1,620
9.8
9.9
15.0
17.2
15.0
13.1
3.3
2.8
21.8
21.3
1.3
1.2
L G Balakrishnan & Bros Neutral
684
-
1,074
1,302
1,432
11.6
11.9
43.7
53.0
15.7
12.9
2.2
2.0
13.8
14.2
0.9
0.8
Mahindra and Mahindra Neutral
1,369
-
85,049
46,534
53,077
11.6
11.7
67.3
78.1
20.3
17.5
3.3
2.9
15.4
15.8
1.7
1.5
Maruti
Neutral
5,799
-
175,164
69,186
82,217
14.7
14.4
198.5
241.4
29.2
24.0
5.7
4.6
20.2
20.0
2.2
1.8
Minda Industries
Neutral
384
-
3,050
2,728
3,042
9.0
9.1
68.2
86.2
5.6
4.5
1.3
1.0
23.8
24.3
1.1
1.0
Motherson Sumi
Neutral
323
-
45,358
45,896
53,687
7.8
8.3
13.0
16.1
24.8
20.1
8.0
6.4
34.7
35.4
1.1
0.9
Rane Brake Lining
Neutral
1,084
-
858
511
562
11.3
11.5
28.1
30.9
38.6
35.1
5.9
5.4
15.3
15.0
2.1
1.9
Setco Automotive
Neutral
42
-
562
741
837
13.0
13.0
15.2
17.0
2.8
2.5
0.5
0.4
15.8
16.3
1.2
1.1
Tata Motors
Neutral
514
-
148,402
300,209
338,549
8.9
8.4
42.7
54.3
12.1
9.5
1.9
1.6
15.6
17.2
0.6
0.6
TVS Motor
Neutral
401
-
19,030
13,390
15,948
6.9
7.1
12.8
16.5
31.4
24.2
7.8
6.2
26.3
27.2
1.5
1.2
Amara Raja Batteries
Buy
1,029
1,218
17,571
5,429
6,471
17.5
17.6
35.3
43.5
29.1
23.7
6.7
5.4
25.3
24.8
3.1
2.5
Exide Industries
Neutral
197
-
16,749
7,439
8,307
15.0
15.0
8.1
9.3
24.3
21.2
3.4
3.0
14.3
16.7
1.9
1.7
Apollo Tyres
Accumulate
199
235
10,145
12,877
14,504
14.3
13.9
21.4
23.0
9.3
8.7
1.4
1.3
16.4
15.2
1.0
0.9
Ceat
Accumulate
1,204
1,450
4,869
7,524
8,624
13.0
12.7
131.1
144.3
9.2
8.3
1.7
1.4
19.8
18.6
0.8
0.7
JK Tyres
Neutral
143
-
3,246
7,455
8,056
15.0
15.0
21.8
24.5
6.6
5.8
1.4
1.1
22.8
21.3
0.6
0.5
Swaraj Engines
Neutral
1,375
-
1,708
660
810
15.2
16.4
54.5
72.8
25.2
18.9
7.9
7.1
31.5
39.2
2.4
1.9
Subros
Neutral
167
-
999
1,488
1,681
11.7
11.9
6.4
7.2
26.0
23.2
2.8
2.5
10.8
11.4
0.8
0.7
Indag Rubber
Neutral
189
-
497
286
326
19.8
16.8
11.7
13.3
16.2
14.2
2.7
2.6
17.8
17.1
1.5
1.3
Capital Goods
ACE
Neutral
56
-
551
709
814
4.1
4.6
1.4
2.1
39.8
26.5
1.6
1.6
4.4
6.0
0.8
0.7
BEML
Buy
916
1,157
3,813
3,451
4,055
6.3
9.2
31.4
57.9
29.2
15.8
1.8
1.6
6.3
10.9
1.2
1.0
Bharat Electronics
Accumulate
1,302
1,414
31,244
8,137
9,169
16.8
17.2
58.7
62.5
22.2
20.8
3.4
3.1
44.6
46.3
2.7
2.4
Stock Watch
November 03, 2016
Company Name
Reco
CMP
Target
Mkt Cap
Sales ( Čcr )
OPM(%)
EPS (Č)
PER(x)
P/BV(x)
RoE(%)
EV/Sales(x)
(Č)
Price ( Č)
( Č cr )
FY17E
FY18E
FY17E
FY18E
FY17E
FY18E
FY17E
FY18E
FY17E
FY18E
FY17E
FY18E
FY17E
FY18E
Capital Goods
Voltas
Neutral
373
-
12,347
6,511
7,514
7.9
8.7
12.9
16.3
28.9
22.9
5.2
4.6
16.7
18.5
1.8
1.5
BGR Energy
Neutral
119
-
858
16,567
33,848
6.0
5.6
7.8
5.9
15.3
20.2
0.9
0.8
4.7
4.2
0.2
0.1
BHEL
Neutral
137
-
33,606
28,797
34,742
-
2.8
2.3
6.9
59.7
19.9
1.0
1.0
1.3
4.8
0.8
0.6
Blue Star
Buy
557
634
5,307
4,283
5,077
5.9
7.3
14.9
22.1
37.4
25.2
7.3
6.1
20.4
26.4
1.3
1.1
Crompton Greaves
Neutral
77
-
4,835
5,777
6,120
5.9
7.0
3.3
4.5
23.4
17.1
1.0
1.0
4.4
5.9
0.8
0.7
Greaves Cotton
Neutral
137
-
3,351
1,755
1,881
16.8
16.9
7.8
8.5
17.6
16.1
3.5
3.3
20.6
20.9
1.6
1.5
Inox Wind
Buy
218
286
4,827
5,605
6,267
15.7
16.4
24.8
30.0
8.8
7.3
2.4
1.8
25.9
24.4
0.9
0.8
KEC International
Neutral
123
-
3,160
9,294
10,186
7.9
8.1
9.9
11.9
12.4
10.3
1.8
1.6
15.6
16.3
0.6
0.5
Thermax
Neutral
851
-
10,137
5,421
5,940
7.3
7.3
25.7
30.2
33.1
28.2
4.0
3.7
12.2
13.1
1.8
1.6
VATech Wabag
Buy
489
681
2,664
3,136
3,845
8.9
9.1
26.0
35.9
18.8
13.6
2.4
2.0
13.4
15.9
0.8
0.6
Cement
ACC
Neutral
1,491
-
27,995
11,225
13,172
13.2
16.9
44.5
75.5
33.5
19.8
3.2
2.9
11.2
14.2
2.6
2.2
Ambuja Cements
Neutral
241
-
47,775
9,350
10,979
18.2
22.5
5.8
9.5
41.5
25.3
3.5
3.1
10.2
12.5
5.3
4.5
India Cements
Neutral
155
-
4,763
4,364
4,997
18.5
19.2
7.9
11.3
19.6
13.7
1.4
1.4
8.0
8.5
1.9
1.6
JK Cement
Neutral
909
-
6,356
4,398
5,173
15.5
17.5
31.2
55.5
29.1
16.4
3.5
3.0
12.0
15.5
2.0
1.7
J K Lakshmi Cement
Accumulate
482
565
5,676
2,913
3,412
14.5
19.5
7.5
22.5
64.3
21.4
4.0
3.3
12.5
18.0
2.6
2.2
Orient Cement
Buy
171
215
3,503
2,114
2,558
18.5
20.5
8.1
11.3
21.1
15.1
3.1
2.6
9.0
14.0
2.3
1.8
UltraTech Cement
Neutral
3,895
-
106,892
25,768
30,385
21.0
23.5
111.0
160.0
35.1
24.3
4.5
3.9
13.5
15.8
4.4
3.6
Construction
ITNL
Neutral
105
-
3,467
8,946
10,017
31.0
31.6
8.1
9.1
13.0
11.6
0.5
0.5
4.2
5.0
3.8
3.5
KNR Constructions
Neutral
722
-
2,032
1,385
1,673
14.7
14.0
41.2
48.5
17.5
14.9
3.3
2.8
14.9
15.2
1.7
1.4
Larsen & Toubro
Accumulate
1,446
1,700
134,801
67,665
77,249
10.7
11.5
57.3
71.2
25.2
20.3
2.3
2.2
12.6
14.3
2.2
1.9
Gujarat Pipavav Port
Neutral
168
-
8,127
705
788
52.2
51.7
5.0
5.6
33.6
30.0
3.3
3.0
11.2
11.2
11.3
9.6
Nagarjuna Const.
Neutral
89
-
4,953
8,842
9,775
9.1
8.8
5.3
6.4
16.8
13.9
1.3
1.2
8.2
9.1
0.8
0.7
PNC Infratech
Buy
120
143
3,087
2,350
2,904
13.1
13.2
9.0
8.8
13.4
13.7
0.5
0.4
15.9
13.9
1.5
1.2
Simplex Infra
Neutral
322
-
1,592
6,829
7,954
10.5
10.5
31.4
37.4
10.3
8.6
1.1
1.0
9.9
13.4
0.7
0.6
Power Mech Projects
Neutral
495
-
728
1,801
2,219
12.7
14.6
72.1
113.9
6.9
4.4
1.3
1.1
16.8
11.9
0.4
0.3
Sadbhav Engineering
Accumulate
269
298
4,606
3,598
4,140
10.3
10.6
9.0
11.9
29.8
22.6
3.1
2.7
9.9
11.9
1.6
1.4
NBCC
Neutral
240
-
14,373
7,428
9,549
7.9
8.6
8.2
11.0
29.2
21.8
1.5
1.2
28.2
28.7
1.7
1.2
MEP Infra
Neutral
41
-
674
1,877
1,943
30.6
29.8
3.0
4.2
13.8
9.9
6.7
4.5
0.6
0.6
1.8
1.6
SIPL
Neutral
100
-
3,513
1,036
1,252
65.5
66.2
(8.4)
(5.6)
3.7
4.3
(22.8)
(15.9)
11.8
9.8
Stock Watch
November 03, 2016
Company Name
Reco
CMP
Target
Mkt Cap
Sales ( Čcr )
OPM(%)
EPS (Č)
PER(x)
P/BV(x)
RoE(%)
EV/Sales(x)
(Č)
Price ( Č)
( Č cr )
FY17E
FY18E
FY17E
FY18E
FY17E
FY18E
FY17E
FY18E
FY17E
FY18E
FY17E
FY18E
FY17E
FY18E
Construction
Engineers India
Neutral
262
-
8,840
1,725
1,935
16.0
19.1
11.4
13.9
23.0
18.9
3.2
3.1
13.4
15.3
4.3
3.8
Financials
Axis Bank
Buy
476
630
113,538
46,932
53,575
3.5
3.4
32.4
44.6
14.7
10.7
1.9
1.6
13.6
16.5
-
-
Bank of Baroda
Neutral
150
-
34,539
19,980
23,178
1.8
1.8
11.5
17.3
13.0
8.7
1.5
1.2
8.3
10.1
-
-
Canara Bank
Neutral
294
-
15,972
15,225
16,836
1.8
1.8
14.5
28.0
20.3
10.5
1.4
1.1
5.8
8.5
-
-
Dewan Housing Finance Accumulate
317
350
9,926
2,225
2,688
2.9
2.9
29.7
34.6
10.7
9.2
1.7
1.5
16.1
16.8
-
-
Equitas Holdings
Buy
176
235
5,894
939
1,281
11.7
11.5
5.8
8.2
30.3
21.4
2.6
2.3
10.9
11.5
-
-
Federal Bank
Neutral
79
-
13,642
9,353
10,623
2.9
2.9
4.4
5.8
18.1
13.7
1.7
1.5
9.5
11.0
-
-
HDFC
Neutral
1,404
-
221,952
11,475
13,450
3.4
3.4
45.3
52.5
31.0
26.7
6.0
5.3
20.2
20.5
-
-
HDFC Bank
Accumulate
1,246
1,350
315,468
46,097
55,433
4.5
4.5
58.4
68.0
21.3
18.3
3.7
3.1
18.8
18.6
-
-
ICICI Bank
Neutral
272
-
158,194
39,029
45,903
3.3
3.3
16.7
16.3
16.3
16.7
2.0
1.8
10.1
12.4
-
-
LIC Housing Finance
Accumulate
573
630
28,930
3,712
4,293
2.6
2.5
39.0
46.0
14.7
12.5
2.8
2.4
19.9
20.1
-
-
Punjab Natl.Bank
Neutral
137
-
29,100
23,532
23,595
2.3
2.4
6.8
12.6
20.1
10.9
3.1
2.2
3.3
6.5
-
-
RBL Bank
Accumulate
382
365
14,129
1,783
2,309
2.6
2.6
12.7
16.4
30.1
23.3
3.3
2.9
12.8
13.3
-
-
South Ind.Bank
Neutral
23
-
3,112
6,435
7,578
2.5
2.5
2.7
3.1
8.5
7.4
1.1
0.9
10.1
11.2
-
-
St Bk of India
Neutral
251
-
195,079
88,650
98,335
2.6
2.6
13.5
18.8
18.6
13.4
1.8
1.6
7.0
8.5
-
-
Union Bank
Neutral
139
-
9,562
13,450
14,925
2.3
2.3
25.5
34.5
5.5
4.0
0.8
0.7
7.5
10.2
-
-
Yes Bank
Neutral
1,211
-
50,974
8,978
11,281
3.3
3.4
74.0
90.0
16.4
13.5
3.1
2.6
17.0
17.2
-
-
FMCG
Asian Paints
Neutral
1,062
-
101,872
17,128
18,978
16.8
16.4
19.1
20.7
55.6
51.3
19.4
18.3
34.8
35.5
6.3
5.7
Britannia
Accumulate
3,303
3,626
39,622
9,795
11,040
14.6
14.9
80.3
94.0
41.1
35.1
16.9
13.1
41.2
-
3.9
3.4
Colgate
Accumulate
956
995
26,011
4,605
5,149
23.4
23.4
23.8
26.9
40.2
35.6
22.2
17.4
64.8
66.8
5.5
4.9
Dabur India
Accumulate
294
304
51,772
8,315
9,405
19.8
20.7
8.1
9.2
36.3
32.0
10.1
8.4
31.6
31.0
5.7
5.0
GlaxoSmith Con*
Neutral
5,943
-
24,992
4,350
4,823
21.2
21.4
179.2
196.5
33.2
30.3
8.8
7.5
27.1
26.8
5.3
4.7
Godrej Consumer
Neutral
1,563
-
53,227
10,235
11,428
18.4
18.6
41.1
44.2
38.0
35.4
8.4
7.1
24.9
24.8
5.5
4.8
HUL
Neutral
841
-
182,110
35,252
38,495
17.6
17.4
20.4
21.9
41.2
38.4
33.9
29.7
82.2
77.3
4.9
4.5
ITC
Buy
237
283
286,440
40,059
44,439
39.0
39.2
9.1
10.1
26.1
23.5
7.1
6.2
27.2
26.5
6.7
6.0
Marico
Accumulate
269
300
34,648
6,430
7,349
18.8
19.5
6.4
7.7
42.0
34.9
12.7
10.7
33.2
32.5
5.5
4.8
Nestle*
Neutral
6,749
-
65,067
10,073
11,807
20.7
21.5
124.8
154.2
54.1
43.8
22.2
20.0
34.8
36.7
6.3
5.4
Tata Global
Neutral
135
-
8,517
8,675
9,088
9.8
9.8
7.4
8.2
18.2
16.5
2.1
2.0
7.9
8.1
1.0
0.9
Procter & Gamble
Neutral
7,160
-
23,243
2,939
3,342
23.2
23.0
146.2
163.7
49.0
43.7
109.7
105.1
25.3
23.5
7.3
6.4
Hygiene
Stock Watch
November 03, 2016
Company Name
Reco
CMP
Target
Mkt Cap
Sales ( Čcr )
OPM(%)
EPS (Č)
PER(x)
P/BV(x)
RoE(%)
EV/Sales(x)
(Č)
Price ( Č)
( Č cr )
FY17E FY18E
FY17E
FY18E
FY17E
FY18E
FY17E
FY18E
FY17E
FY18E
FY17E
FY18E
FY17E
FY18E
IT
HCL Tech^
Buy
764
1,000
107,803
49,242
57,168
20.5
20.5
55.7
64.1
13.7
11.9
2.8
2.1
20.3
17.9
2.2
1.8
Infosys
Buy
981
1,249
225,353
68,350
77,326
27.0
27.0
62.5
69.4
15.7
14.1
3.4
3.1
21.3
21.6
2.9
2.5
TCS
Accumulate
2,304
2,620
454,075
119,025
133,308
27.6
27.6
131.2
145.5
17.6
15.8
5.7
5.2
32.4
33.1
3.7
3.3
Tech Mahindra
Buy
430
700
41,740
30,347
33,685
17.0
17.0
37.5
41.3
11.5
10.4
2.5
2.2
21.8
20.7
1.1
0.9
Wipro
Buy
458
590
111,315
55,440
60,430
18.1
18.1
35.9
39.9
12.8
11.5
2.3
2.1
19.0
19.3
1.8
1.7
Media
D B Corp
Neutral
381
-
7,005
2,297
2,590
27.4
28.2
21.0
23.4
18.2
16.3
4.2
3.7
23.7
23.1
2.9
2.5
HT Media
Neutral
86
-
2,000
2,693
2,991
12.6
12.9
7.9
9.0
10.9
9.6
0.9
0.9
7.8
8.3
0.4
0.2
Jagran Prakashan
Accumulate
195
225
6,378
2,355
2,635
28.0
28.0
10.8
12.5
18.1
15.6
3.9
3.4
21.7
21.7
2.8
2.4
Sun TV Network
Neutral
534
-
21,048
2,850
3,265
70.1
71.0
26.2
30.4
20.4
17.6
5.2
4.6
24.3
25.6
7.0
5.9
Hindustan Media
Neutral
301
-
2,209
1,016
1,138
24.3
25.2
27.3
30.1
11.0
10.0
2.1
1.9
16.2
15.8
1.5
1.3
Ventures
TV Today Network
Accumulate
349
363
2,079
637
743
27.5
27.5
18.4
21.4
19.0
16.3
3.3
2.8
17.4
17.2
2.7
2.3
Metals & Mining
Coal India
Neutral
328
-
206,987
84,638
94,297
21.4
22.3
24.5
27.1
13.4
12.1
5.6
5.3
42.6
46.0
1.9
1.7
Hind. Zinc
Neutral
270
-
113,957
14,252
18,465
55.9
48.3
15.8
21.5
17.1
12.5
2.8
2.4
17.0
20.7
7.5
5.8
Hindalco
Neutral
156
-
32,286
107,899
112,095
7.4
8.2
9.2
13.0
17.0
12.0
0.8
0.8
4.8
6.6
0.8
0.8
JSW Steel
Neutral
1,634
-
39,494
53,201
58,779
16.1
16.2
130.6
153.7
12.5
10.6
1.7
1.5
14.0
14.4
1.5
1.3
NMDC
Neutral
138
-
54,852
6,643
7,284
44.4
47.7
7.1
7.7
19.5
18.0
1.7
1.6
8.8
9.2
5.1
4.6
SAIL
Neutral
51
-
21,229
47,528
53,738
(0.7)
2.1
(1.9)
2.6
19.8
0.6
0.5
(1.6)
3.9
1.3
1.2
Vedanta
Neutral
218
-
64,704
71,744
81,944
19.2
21.7
13.4
20.1
16.3
10.9
1.4
1.3
8.4
11.3
1.2
0.9
Tata Steel
Neutral
414
-
40,174
121,374
121,856
7.2
8.4
18.6
34.3
22.2
12.1
1.4
1.3
6.1
10.1
1.0
1.0
Oil & Gas
Cairn India
Neutral
241
-
45,184
9,127
10,632
4.3
20.6
8.8
11.7
27.4
20.6
0.9
0.9
3.3
4.2
6.2
5.1
GAIL
Neutral
429
-
54,392
56,220
65,198
9.3
10.1
27.1
33.3
15.8
12.9
1.5
1.4
9.3
10.7
1.2
1.0
ONGC
Neutral
277
-
237,287
137,222
152,563
15.0
21.8
19.5
24.1
14.2
11.5
1.2
1.2
8.5
10.1
2.1
1.9
Indian Oil Corp
Neutral
316
-
153,495
373,359
428,656
5.9
5.5
54.0
59.3
5.9
5.3
0.9
0.8
16.0
15.6
0.6
0.5
Reliance Industries
Neutral
1,024
-
332,043
301,963
358,039
12.1
12.6
87.7
101.7
11.7
10.1
1.2
1.1
10.7
11.3
1.6
1.3
Pharmaceuticals
Alembic Pharma
Neutral
673
-
12,679
3,483
4,083
20.2
21.4
24.3
30.4
27.7
22.1
6.3
5.0
25.5
25.3
3.6
3.0
Aurobindo Pharma
Accumulate
789
877
46,170
15,720
18,078
23.7
23.7
41.4
47.3
19.1
16.7
5.0
3.9
29.6
26.1
3.3
2.9
Sanofi India*
Neutral
4,256
-
9,802
2,357
2,692
17.3
17.3
153.5
169.2
27.7
25.2
4.7
3.8
25.8
28.4
3.9
3.2
Cadila Healthcare
Neutral
405
-
41,503
11,126
13,148
22.0
22.0
17.1
20.0
23.7
20.3
6.1
4.8
28.8
26.6
3.8
3.1
Cipla
Sell
559
490
44,903
15,378
18,089
17.4
18.4
21.6
27.2
25.9
20.5
3.4
2.9
13.7
15.2
3.3
2.7
Stock Watch
November 03, 2016
Company Name
Reco
CMP
Target
Mkt Cap
Sales ( Čcr )
OPM(%)
EPS (Č)
PER(x)
P/BV(x)
RoE(%)
EV/Sales(x)
(Č)
Price ( Č)
( Č cr )
FY17E FY18E
FY17E
FY18E
FY17E
FY18E
FY17E
FY18E
FY17E
FY18E
FY17E
FY18E
FY17E
FY18E
Pharmaceuticals
Dr Reddy's
Neutral
3,258
-
53,991
16,043
18,119
23.1
24.7
126.0
157.8
25.9
20.7
3.8
3.3
15.7
17.1
3.3
2.9
Dishman Pharma
Sell
245
45
3,961
1,718
1,890
22.7
22.8
9.5
11.3
25.8
21.7
2.5
2.3
10.1
10.9
2.6
2.3
GSK Pharma*
Neutral
2,813
-
23,824
3,528
3,811
16.6
18.8
51.8
59.4
54.3
47.4
14.5
14.5
26.3
30.6
6.8
6.4
Indoco Remedies
Sell
282
225
2,597
1,112
1,289
18.2
18.2
13.2
15.6
21.4
18.1
3.8
3.2
19.2
19.2
2.6
2.2
Ipca labs
Neutral
596
-
7,520
3,303
3,799
15.3
15.3
17.3
19.7
34.5
30.3
3.0
2.7
9.1
9.4
2.5
2.2
Lupin
Buy
1,496
1,809
67,423
15,912
18,644
26.4
26.7
58.1
69.3
25.7
21.6
5.0
4.1
21.4
20.9
4.4
3.6
Sun Pharma
Buy
715
944
172,006
31,129
35,258
30.0
30.9
28.0
32.8
25.5
21.8
3.9
3.3
18.7
18.9
5.4
4.5
Power
Tata Power
Neutral
77
-
20,839
36,916
39,557
17.4
27.1
5.1
6.3
15.1
12.2
1.3
1.2
9.0
10.3
1.6
1.5
NTPC
Neutral
156
-
128,712
86,605
95,545
17.5
20.8
11.8
13.4
13.2
11.7
1.3
1.3
10.5
11.1
2.8
2.8
Power Grid
Neutral
175
-
91,631
25,763
29,762
74.3
73.1
14.8
17.3
11.8
10.1
1.9
1.6
16.9
17.5
7.9
7.5
Real Estate
MLIFE
Buy
421
522
1,728
1,152
1,300
22.7
24.6
29.9
35.8
14.1
11.8
1.0
1.0
7.6
8.6
2.3
1.9
Telecom
Bharti Airtel
Neutral
310
-
123,720
105,086
114,808
34.5
34.7
12.2
16.4
25.4
18.9
1.7
1.6
6.8
8.4
2.1
1.8
Idea Cellular
Neutral
74
-
26,754
40,133
43,731
37.2
37.1
6.4
6.5
11.6
11.4
1.0
0.9
8.2
7.6
1.7
1.4
zOthers
Abbott India
Neutral
4,798
-
10,196
3,153
3,583
14.1
14.4
152.2
182.7
31.5
26.3
154.8
132.2
25.6
26.1
2.9
2.5
Bajaj Electricals
Buy
261
306
2,632
5,099
5,805
5.6
5.9
11.4
14.6
22.9
17.9
3.1
2.7
13.4
15.1
0.5
0.5
Finolex Cables
Neutral
440
-
6,732
2,883
3,115
12.0
12.1
14.2
18.6
31.0
23.7
16.5
14.4
15.8
14.6
2.0
1.8
Goodyear India*
Neutral
788
-
1,817
1,598
1,704
10.4
10.2
49.4
52.6
16.0
15.0
73.6
64.6
18.2
17.0
0.8
113.6
Hitachi
Neutral
1,510
-
4,106
2,081
2,433
8.8
8.9
33.4
39.9
45.2
37.9
36.5
30.4
22.1
21.4
2.0
1.7
Jyothy Laboratories
Neutral
354
-
6,432
1,440
2,052
11.5
13.0
8.5
10.0
41.7
35.4
10.1
9.3
18.6
19.3
4.8
3.3
Page Industries
Neutral
16,144
-
18,007
2,450
3,124
20.1
17.6
299.0
310.0
54.0
52.1
359.6
274.5
47.1
87.5
7.7
6.0
Relaxo Footwears
Neutral
429
-
5,146
2,085
2,469
9.2
8.2
7.6
8.0
56.7
53.9
22.0
18.8
17.9
18.8
2.6
2.2
Siyaram Silk Mills
Accumulate
1,554
1,714
1,457
1,799
2,040
11.6
11.7
104.9
122.4
14.8
12.7
2.4
2.1
16.4
16.4
1.0
0.9
Styrolution ABS India*
Neutral
636
-
1,119
1,440
1,537
9.2
9.0
40.6
42.6
15.7
14.9
40.0
36.4
12.3
11.6
0.8
0.7
TVS Srichakra
Neutral
3,792
-
2,903
2,304
2,614
13.7
13.8
231.1
266.6
16.4
14.2
426.1
335.5
33.9
29.3
1.3
1.1
HSIL
Neutral
346
-
2,503
2,384
2,515
15.8
16.3
15.3
19.4
22.6
17.9
22.5
19.4
7.8
9.3
1.2
1.1
Kirloskar Engines India
Neutral
345
-
4,996
2,554
2,800
9.9
10.0
10.5
12.1
32.9
28.6
13.8
13.0
10.7
11.7
1.6
1.4
Ltd
M M Forgings
Neutral
455
-
549
546
608
20.4
20.7
41.3
48.7
11.0
9.3
62.3
55.2
16.6
17.0
0.8
0.8
Banco Products (India)
Neutral
215
-
1,540
1,353
1,471
12.3
12.4
14.5
16.3
14.9
13.2
20.5
18.5
14.5
14.6
1.1
122.9
Competent Automobiles Neutral
193
-
118
1,137
1,256
3.1
2.7
28.0
23.6
6.9
8.2
37.1
33.5
14.3
11.5
0.1
0.1
Stock Watch
November 03, 2016
Company Name
Reco
CMP
Target
Mkt Cap
Sales ( Čcr )
OPM(%)
EPS (Č)
PER(x)
P/BV(x)
RoE(%)
EV/Sales(x)
(Č)
Price ( Č)
( Č cr )
FY17E
FY18E
FY17E
FY18E
FY17E
FY18E
FY17E
FY18E
FY17E
FY18E
FY17E
FY18E
FY17E
FY18E
zOthers
Nilkamal
Neutral
1,704
-
2,543
1,995
2,165
10.7
10.4
69.8
80.6
24.4
21.1
97.4
84.6
16.6
16.5
1.3
1.2
Visaka Industries
Neutral
219
-
349
1,051
1,138
10.3
10.4
21.0
23.1
10.4
9.5
28.1
26.3
9.0
9.2
0.6
0.6
Transport Corporation of
Neutral
183
-
1,399
2,671
2,911
8.5
8.8
13.9
15.7
13.2
11.7
1.8
1.6
13.7
13.8
0.6
0.6
India
Elecon Engineering
Neutral
64
-
702
1,482
1,660
13.7
14.5
3.9
5.8
16.5
11.1
3.9
3.6
7.8
10.9
0.8
0.7
Surya Roshni
Neutral
232
-
1,018
3,342
3,625
7.8
7.5
17.3
19.8
13.4
11.8
25.5
20.5
10.5
10.8
0.6
0.5
MT Educare
Neutral
132
-
525
366
417
17.7
18.2
9.4
10.8
14.1
12.2
3.1
2.7
22.2
22.3
1.4
1.2
Radico Khaitan
Neutral
139
-
1,853
1,659
1,802
13.0
13.2
6.3
7.4
22.0
18.9
1.9
1.8
8.6
9.3
1.5
1.4
Garware Wall Ropes
Neutral
549
-
1,201
873
938
12.9
13.1
30.9
34.9
17.8
15.7
2.8
2.4
15.7
15.2
1.3
1.2
Wonderla Holidays
Neutral
375
-
2,121
287
355
38.0
40.0
11.3
14.2
33.2
26.4
4.8
4.2
21.4
23.9
7.7
6.2
Linc Pen & Plastics
Neutral
257
-
380
382
420
9.3
9.5
13.5
15.7
19.1
16.4
3.3
2.8
17.1
17.3
1.1
1.0
The Byke Hospitality
Neutral
188
-
755
287
384
20.5
20.5
7.6
10.7
24.8
17.6
5.2
4.2
20.7
23.5
2.6
1.9
Interglobe Aviation
Neutral
940
-
33,870
21,122
26,005
14.5
27.6
110.7
132.1
8.5
7.1
50.8
36.3
168.5
201.1
1.6
1.2
Coffee Day Enterprises
Neutral
222
-
4,567
2,964
3,260
20.5
21.2
4.7
8.0
-
27.7
2.6
2.4
5.5
8.5
2.0
1.7
Ltd
Navneet Education
Neutral
109
-
2,591
1,062
1,147
24.0
24.0
6.1
6.6
17.9
16.4
3.7
3.3
20.6
19.8
2.5
2.3
Navkar Corporation
Buy
203
265
2,893
408
612
42.9
42.3
6.8
11.5
30.0
17.6
2.1
1.9
6.9
10.5
7.9
5.3
UFO Moviez
Neutral
481
-
1,327
619
685
33.2
33.4
30.0
34.9
16.1
13.8
2.2
1.9
13.8
13.9
1.7
1.4
VRL Logistics
Neutral
281
-
2,566
1,902
2,119
16.7
16.6
14.6
16.8
19.3
16.7
4.2
3.7
21.9
22.2
1.6
1.4
Team Lease Serv.
Neutral
994
-
1,699
3,229
4,001
1.5
1.8
22.8
32.8
43.7
30.3
4.7
4.1
10.7
13.4
0.4
0.3
S H Kelkar & Co.
Neutral
311
-
4,498
1,036
1,160
15.1
15.0
6.1
7.2
50.9
43.3
5.4
5.0
10.7
11.5
4.2
3.7
Quick Heal
Neutral
247
-
1,731
408
495
27.3
27.0
7.7
8.8
31.9
28.1
3.0
3.0
9.3
10.6
3.5
2.9
Narayana Hrudaya
Neutral
342
-
6,993
1,873
2,166
11.5
11.7
2.6
4.0
129.4
86.3
7.9
7.2
6.1
8.3
4.0
3.5
Manpasand Bever.
Neutral
709
-
4,057
836
1,087
19.6
19.4
16.9
23.8
42.0
29.8
5.0
4.4
12.0
14.8
4.7
3.5
Parag Milk Foods
Neutral
317
-
2,606
1,919
2,231
9.3
9.6
9.5
12.9
33.6
24.5
5.2
4.3
15.5
17.5
1.5
1.3
Mirza International
Buy
93
113
1,095
1,024
1,148
18.0
18.0
6.9
8.0
13.5
11.7
2.3
1.9
16.6
16.2
1.3
1.1
Asian Granito
Buy
273
351
799
1,118
1,220
11.8
12.0
13.0
16.0
21.0
17.1
2.0
1.8
9.7
10.7
1.0
0.9
Source: Company, Angel Research; Note: *December year end; #September year end; &October year end; Price as on November 02, 2016
Market Outlook
November 03, 2016
Research Team Tel: 022 - 39357800
DISCLAIMER
Angel Broking Private Limited (hereinafter referred to as “Angel”) is a registered Member of National Stock Exchange of India
Limited,Bombay Stock Exchange Limited and Metropolitan Stock Exchange Limited. It is also registered as a Depository Participant with
CDSL and Portfolio Manager with SEBI. It also has registration with AMFI as a Mutual Fund Distributor. Angel Broking Private Limited is a
registered entity with SEBI for Research Analyst in terms of SEBI (Research Analyst) Regulations, 2014 vide registration number
INH000000164. Angel or its associates has not been debarred/ suspended by SEBI or any other regulatory authority for accessing
/dealing in securities Market. Angel or its associates/analyst has not received any compensation / managed or
co-managed public offering of securities of the company covered by Analyst during the past twelve months.
This document is solely for the personal information of the recipient, and must not be singularly used as the basis of any investment
decision. Nothing in this document should be construed as investment or financial advice. Each recipient of this document should make
such investigations as they deem necessary to arrive at an independent evaluation of an investment in the securities of the companies
referred to in this document (including the merits and risks involved), and should consult their own advisors to determine the merits and
risks of such an investment.
Reports based on technical and derivative analysis center on studying charts of a stock's price movement, outstanding positions and
trading volume, as opposed to focusing on a company's fundamentals and, as such, may not match with a report on a company's
fundamentals. Investors are advised to refer the Fundamental and Technical Research Reports available on our website to evaluate the
contrary view, if any.
The information in this document has been printed on the basis of publicly available information, internal data and other reliable
sources believed to be true, but we do not represent that it is accurate or complete and it should not be relied on as such, as this
document is for general guidance only. Angel Broking Pvt. Limited or any of its affiliates/ group companies shall not be in any way
responsible for any loss or damage that may arise to any person from any inadvertent error in the information contained in this report.
Angel Broking Pvt. Limited has not independently verified all the information contained within this document. Accordingly, we cannot
testify, nor make any representation or warranty, express or implied, to the accuracy, contents or data contained within this document.
While Angel Broking Pvt. Limited endeavors to update on a reasonable basis the information discussed in this material, there may be
regulatory, compliance, or other reasons that prevent us from doing so.
This document is being supplied to you solely for your information, and its contents, information or data may not be reproduced,
redistributed or passed on, directly or indirectly.
Neither Angel Broking Pvt. Limited, nor its directors, employees or affiliates shall be liable for any loss or damage that may arise from
or in connection with the use of this information.